Executive Summary
Who chooses independent schools, and why? Several studies explored this research question about fifteen years ago in Alberta and Ontario, but this question has not previously been explored from a pan-Canadian perspective. This paper, replicating Van Pelt, Allison, and Allison (2007), is the final edition of a three-part, pan-Canadian series investigating the perceptions of independent-school parents. Using the same research question and methodology as the British Columbia (BC) and Ontario versions (Hunt and Van Pelt 2019; Van Pelt, Hunt, and Wolfert 2019), this paper examines the findings in Alberta.
Alberta independent-school households are more likely to be community-oriented, married-couple families than Albertans in general. For example, Alberta independent school parents are:
- 40 percent more likely to be active in a group, organization, or association, and are involved on average in two.
- 30 percent more likely than other Alberta households with children to be married-couple families.
- Considerably more likely to be people of faith or religiously affiliated. Even in non-religious independent schools, the overwhelming majority of families—70 percent—identify as religious.
- Considerably more likely to vote in every municipal, provincial, and federal election (86 percent compared to less than half of Albertans).
Independent-school parents in Alberta are also better educated, but their occupations and income do not reflect “elite” socioeconomic stereotypes. Alberta independent school parents are:
- 12 percent more likely than the average Albertan aged twenty-five to sixty-four to have post-secondary education.
- 60 percent more likely to have completed education above the bachelor’s level.
- Four times more likely to be teachers, nineteen times more likely to be farmers, and more than twice as likely to be nurses.
- 1.3 times more likely than other couple-family Alberta households to earn below $90,000 annual household income (possibly reflecting a larger share of single-income-earner households).
In other words, Alberta independent-school families work middle-class jobs and earn less income than their middle-class peers, despite having more education. In addition, there are at least two more reasons to dismiss myths of elitism:
- 85 percent of non-religious independent schools’ parents went to government schools.
- Only 1.7 percent found it very difficult to enroll in their preferred school, while 93 percent report it being very or somewhat easy. Put plainly, they are not socially exclusive establishments.
However, affording tuition can be a challenge. Specifically:
- 88 percent of parents have made financial sacrifices to afford the cost of independent schooling.
- Over 20 percent have made major financial sacrifices—as defined by working multiple jobs, changing jobs, taking out a new loan, or moving or downsizing their house.
Most of these findings—from family to community to education to occupation to sacrifice—are consistent with the BC and Ontario findings, but there are some key differences worth highlighting:
- Unlike their peers in the other two provinces, Alberta independent-school parents are as likely as other Albertans to hold a trade certificate or diploma as their highest credential. In other words, Alberta independent school parents are more “blue-collar” than their peers in other provinces.
- Another difference is where parents went to school. The recent Ontario and BC findings confirm a decades-long macrotrend away from government-run to independent schools. This does not appear to be the case in Alberta, as Alberta religious-independent-school parents are three times more likely than BC parents and twice as likely as Ontario parents to have attended the same independent school as their child. Although this is a religious-school phenomenon in Alberta, it is also noteworthy that Alberta independent-school families as a whole are more likely to commit to one school long-term. This may also reflect Alberta independent-school families’ greater likelihood to live in a rural setting, where educational options are more limited.
WHY PARENTS CHOOSE ALBERTA INDEPENDENT SCHOOLS
Parents choose independent schools for a multitude of reasons, but virtually all of these parents have the following in common, regardless of the type of independent school:
- They chose the school for its supportive, nurturing, and safe environment that instills confidence and character in students.
- The least important factors for parents include the cost of their school compared to others, geographic proximity to home, transportation options, opportunity for additional after-hour activities, and teachers regularly assigning homework.
Families in non-religious and religious independent schools have different motivations for choosing their schools. Only one of the forty-seven surveyed reasons appears in the top five for both sets of parents: the independent school’s supportive and nurturing environment.
For non-religious independent schools, parents’ top five reasons for choosing are that the school:
- Instills confidence in students.
- Has happy students.
- Offers a supportive and nurturing environment.
- Has small class sizes.
- Teaches students to think critically and independently.
The top five reasons families choose a religious independent school are that the school:
- Supports their family’s values.
- Teaches right from wrong.
- Is a safe school.
- Offers a supportive and nurturing environment.
- Uses curriculum parents trust.
Safety ranks high for both school types and, when the two school types are combined, ranks in the top two reasons for all three provinces surveyed. Moreover, the differences in parental reasons for each school type are relatively similar across provinces.
Finally, it is important to note the difference between a large list of important characteristics and one’s “most important” reason for enrolling at their school. When asked open-endedly, the most important reason for the largest number of respondents relates to reinforcing religious beliefs or receiving a faith-based education.
IMPLICATIONS
The findings have at least three implications for the independent-school community. First, academics, extracurriculars, and facilities are not parents’ highest priorities. Second, parents may not be as price-sensitive to tuition as assumed, since they are willing to make considerable financial sacrifices to make it work. And third, school growth does not come from sophisticated marketing but word of mouth. Therefore, the independent schools that best care for their students and families, by providing an atmosphere and community that is nurturing, supportive, and safe—in other words, one where families want to be, and one they trust—is the most important thing, and will lead to the word-of-mouth referrals that will generate future growth.
Introduction
This paper is the third in a series of provincial studies. It begins with an overview of Alberta’s independent-school sector, followed by the sample description of the 2019–20 Alberta survey of independent-school parents, and a presentation and analysis of the survey results. The presentation of the findings begins with the characteristics of independent-school families, to answer the question, Who chooses Alberta independent schools? The second part of the analysis explores the reasons why these parents choose independent schools.
Overview of Independent Schools in Alberta
Alberta has the most pluralistic education system in Canada. This is evidenced in at least six ways. First, it is the only province with charter schools (government schools outside the local school district’s authority). Second, it is one of the three provinces with a fully-taxpayer-funded, constitutionally protected, separate Catholic school system (along with Saskatchewan and Ontario). Third, it has religious schools within the local-government school districts, known as alternative schools. Fourth, it has a robust Francophone government-run school sector. Fifth, it has the most generously taxpayer-funded home-based education sector. And sixth, it has the most generously funded independent-school sector in Canada.
Alberta, however, also has one of Canada’s more complex regulatory frameworks for independent schools. The Alberta government divides independent schools into three types: registered independent schools (non-taxpayer-funded), accredited independent schools (non-taxpayer-funded), and accredited taxpayer-funded independent schools. The schools in this third group receive up to 70 percent of the per-student grant that government schools receive for operating expenses. No independent schools receive capital grants. Within funded independent schools, there are two additional special designations: special-education independent schools and heritage-language schools.
All Alberta independent schools must meet the basic requirements set out in the Private Schools Regulation subsection of the Education Act and are required to submit operating plans annually to the Ministry of Education. Those who meet the most basic requirements are called registered independent schools. Those who in addition employ certified teachers are designated non-funded accredited schools. And to receive provincial operating grants, funded accredited independent schools are required to teach the government-mandated programs of study and have a certificated principal (Alberta 2020a).
It is also worth noting that although the school categories are straightforward, the regulations pertaining to them are not. The clear and enabling language of the School Act is not accurately exhibited in the Private Schools Regulation subsection, which is burdensome. In practice, complex regulations make it difficult to open a new independent school or expand an existing one. Adding another physical location or altering programming (e.g., expanding from K–9 to include grades 10–12) are treated as new school approvals. The regulations restrict independent schools’ ability to expand and innovate, placing downward pressure on enrolment. Moreover, the yearly approval process mentioned above, although beneficial for accountability and monitoring, creates uncertainty with its annual frequency and changing budget allocations. This makes it difficult for independent schools to plan—let alone grow.
Most independent schools in Alberta are operated by non-profit organizations, charities, or religious organizations (Clemens, Emes, and MacLeod 2018). To receive taxpayer funding, they must be not for profit. The schools often offer educational approaches not readily available in government-run schools. For example, independent schools offer programs in alternative pedagogies (such as Montessori, Waldorf, and self-directed or independent learning), athletic academies, programs with a specific focus, such as fine arts or STEM, and faith-based education. Approximately two-thirds of Alberta independent-school students are enrolled in religious schools, primarily non-Catholic Christian.
According to data published by the Ministry of Education, there are currently 191 independent schools under 151 independent-school authorities operating in Alberta (Alberta Education 2020), enrolling over 33,141 students (Alberta 2020b), or 4.5 percent of total provincial K–12 enrolment. If we include the 7,169 students enrolled with an early childhood services (ECS) private operator, this total rises to 40,310, or 5.4 percent. While this is a small share of total Alberta K–12 enrolment, independent-school growth has outpaced government-school growth by more than double over the last twenty-five years—increasing over 50 percent.
Research Approach and Sample Description
This research uses the same research question (Who chooses independent schools in Alberta, and why?) and the same methodology as the BC and Ontario studies in the series (Hunt and Van Pelt 2019; Van Pelt, Hunt, and Wolfert 2019), to examine the findings in Alberta.
To create a representative sample of the Alberta independent-school sector, all Alberta independent schools were stratified, and eighteen were randomly selected that, assuming a similar response rate, proportionately reflected the Alberta independent-school sector and student population. From these eighteen schools, 225 parent respondents started an online survey and 173 fully completed it, representing 512 and 427 students, respectively. At least 440 parents are represented. By school type, 16.5 percent and 83.5 percent of respondents have a child in a non-religious and religious independent school, respectively. Non-religious-school respondents include families enrolled at both specialty and university-preparatory independent schools, and religious-school respondents include families from a variety of Christian schools, one Jewish school, and two schools of faiths other than Christian or Jewish.1 Geographically, Northern Alberta, Greater North Central, and Southern Alberta are all represented, as well as at least 20 percent participant representation from each of urban, suburban, small-town, and rural communities. Thirty-four percent of respondents (61) live in a rural setting, compared to 19 percent and 16 percent of Canadians and Albertans, respectively (Statistics Canada 2018). This rural representation also contrasts sharply with independent-school enrolment in BC and Ontario, with their 3.5 percent and 22 percent rural share of independent-school families, respectively (Hunt and Van Pelt 2019; Van Pelt, Hunt, and Wolfert 2019).
It is also worth noting that all data was collected before the COVID-19 lockdown. Please see the appendix for a detailed description of the methodology and its limitations.
Figure 1 shows the survey representation by school grade: 11.7 percent of participants have a child in ECS or kindergarten, 50.8 percent have a child in elementary school (grades 1–6), 19.3 percent have a child in junior high school (grades 7–9), and 18.2 percent have a child in senior high school (grades 10–12).

Characteristics of Independent-School Families
The findings and analysis of Alberta independent-school families are presented in this section and compared to the most recent demographic data from Statistic Canada’s 2016 Census and 2013 General Social Survey.
PARENTS’ EDUCATIONAL BACKGROUND
The first characteristic explored is independent-school parents’ own educational background. The research of Van Pelt, Allison, and Allison (2007, 15) reaffirmed the decades-long trend in Ontario schooling away from government-run to independent schools. Our latest Ontario findings confirm this shift, as do the BC findings. This does not seem to be the case in Alberta.
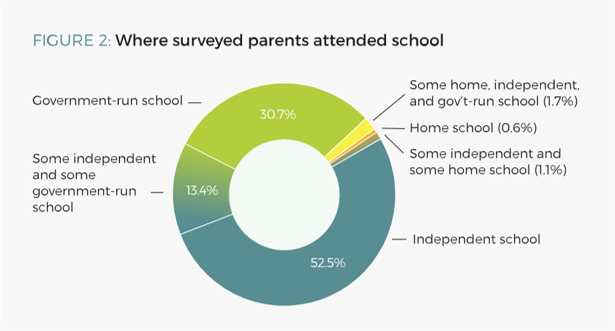
Less than half of Alberta independent-school parents, 45.8 percent (82/179), at some point in their own K–12 education attended a government school, with 30.7 percent of the total (55) only government-school-educated, as presented in figure 2. Likewise, 68.7 percent of parents (123) attended some independent school, and 52.5 percent (94) attended only independent school. Furthermore, 3.4 percent (6) had some homeschool experience as a student, and just one respondent was exclusively homeschooled. Combined, 83.8 percent (150) attended only one of the three sectors—government school, independent school, or homeschool—with the remaining 16.2 percent (29) switching between at least two of them, to enrol in multiple sectors.
The minimal homeschool background is expected. Homeschoolers constitute just 1.4 percent of Alberta’s and 0.4 percent of Canada’s respective student populations (Van Pelt 2015, 23), and less than 2 percent of homeschooling parents were themselves homeschooled (Van Pelt 2003, 34).
Religious-school parents are considerably more likely to have attended independent school themselves: these parents are more than twice as likely as other independent-school parents to have themselves attended independent school (73.4% versus 35%), and more than three times as likely to have attended only independent schools (57.6% versus 15%). This likelihood is similar for BC and Ontario today (Hunt and Van Pelt 2019; Van Pelt, Hunt, and Wolfert 2019), as well as Ontario thirteen years ago (Van Pelt, Allison, and Allison 2007), but the degree to which it exists in Alberta is considerably higher. In fact, 36 percent (56/158) of Alberta religious-independent-school parents attended at some point the same school as their child, compared to just 12.4 percent in BC and 18.7 percent in Ontario. Furthermore, 29.7 percent of Alberta religious-independent-school parents attended only their child’s school in their K–12 years. This is a religious-independent-school phenomenon, however, which by and large are middle-class institutions.
When excluding religious schools, 85 percent of non-religious-independent-school parents (17) attended some government-run and two-thirds (13) attended only government-run school. This finding is important and very similar to BC and Ontario (Hunt and Van Pelt 2019; Van Pelt, Hunt, and Wolfert 2019). Put differently, only 15 percent of non-religious-school parents did not attend a government school. This one-generation transition from government-run to independent school is worth noting.
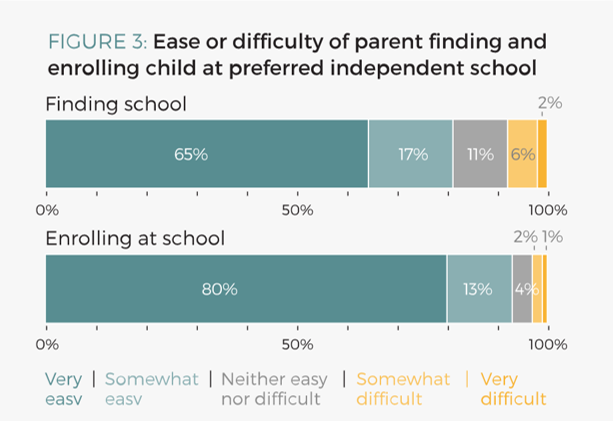
Finding and enrolling in their preferred school was easy for over 81 percent (147) and 92.8 percent (167) of parents, respectively. Only 7.7 percent expressed difficulty finding their school, with 1.7 percent of total respondents expressing great difficulty. Just 2.8 percent had difficulty enrolling their child(ren), with a single respondent (0.6%) finding it very difficult to enrol in their preferred school, as shown in figure 3. These findings are remarkably similar to Ontario but diverge from BC, in that BC parents find it twice as difficult to find and enrol in their preferred school.
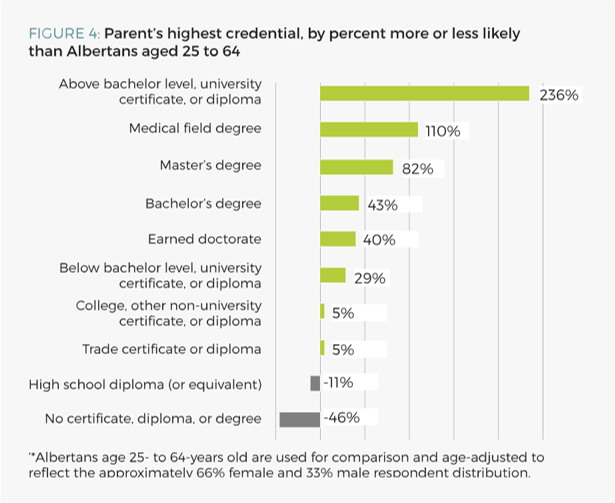
Independent-school parents are better educated than Albertans in general. Controlling for sex,2 they are 12 percent more likely than the average Albertan aged twenty-five to sixty-four to have post-secondary education, at 72.1 percent versus 64.4 percent, respectively, and 1.6 times more likely to have a credential higher than a bachelor’s degree (47% versus 29%) (Statistics Canada 2017). Figure 4 shows the greater likelihood by credential type, and figure 5 presents Alberta independent-school parents’ highest academic or professional credential, compared to other Albertans, in order of rank. Independent-school parents are over three times more likely to have a post-baccalaureate diploma or above-bachelor professional degree (5% compared to 1.5% of Albertans between twenty-five and sixty-four years old), twice as likely to have a master’s degree (9.5% versus 5%) or a medical-field degree (1.7% versus 0.8%), and 1.4 times more likely to have an earned doctorate degree (1.1% versus 0.8%). They are also 1.4 times more likely to hold a bachelor’s degree (29.6% versus 20.6%), and half as likely to not have completed high school or equivalent (5.6% versus 10.4%).
Most of these findings are similar to BC and Ontario, especially the latter. But one finding is a notable exception. Unlike their peers in the other two provinces, Alberta independent-school parents are as likely as other Albertans to hold a trade certificate or diploma as their highest credential (8.9% versus 8.5%), which is 1.8 times and 2.5 times more likely than independent-school parents in BC and Ontario, respectively. In other words, Alberta independent school parents are more “blue-collar” than their peers in other provinces.
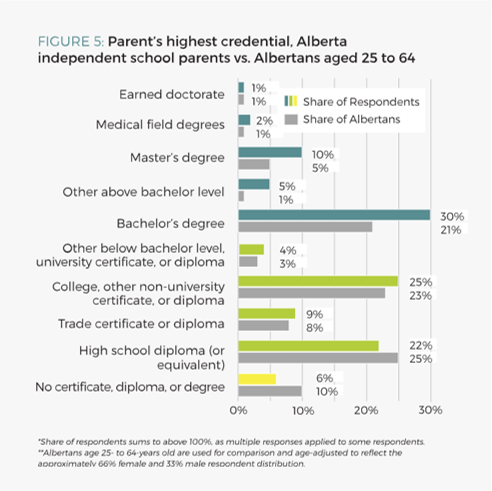
There are also post-secondary educational differences between non-religious- and religious-independent-school parents. A bachelor’s degree is the most common highest credential for both, at 33.3 percent of non-religious-school parents and 25 percent of religious-school parents, for a combined 29.6 percent compared to 20.6 percent of Albertans aged twenty-five to sixty-four. All in all, 90.5 percent of non-religious and 73.3 percent of religious school parents, respectively, have some post-secondary education.
EMPLOYMENT
In presenting the occupations of independent-school parents and comparing them to Albertans as a whole, both the broad and specific National Occupation Classifications (NOCs) from Statistics Canada are addressed separately for clarity, and all percentage data is adjusted to control for sex, due to the overrepresentation of female survey respondents in the sample.
The occupations of independent-school parents vary considerably from the Alberta average. Independent-school parents in the labour force are nearly 6.8 times more likely to work in natural resources, agriculture, and related production occupations (14.3% versus 2.1%), compared to twenty-five- to sixty-four-year-old Albertans in the labour force (Statistics Canada 2019; 2020b). They are 1.5 times more likely to work in health occupations (13% versus 8.8%); 1.4 times more likely to work in education, law, and social, community, and government-services occupations (16.8% versus 12.3%); and slightly more likely to work in trades, transport and equipment operators, and related occupations (14.3% versus 13.2%). The latter is Alberta’s largest occupational category, representing 31.1 percent and 2.9 percent of Alberta’s male and female labour force, respectively—for a combined 18 percent of Alberta’s total labour force (when not controlling for sex).
But with the exception of management occupations, independent-school parents are less likely to work in the remaining NOCs. They are neither more nor less likely to work in management occupations (11.2% versus 11.7%). Most notably, they are 4.4 times less likely to work in manufacturing and utilities occupations (0.6% versus 2.8%); 3.4 times less likely to work in arts, culture, recreation, and sport occupations (0.6% versus 2.1%); 2.8 times less likely to work in sales and service occupations (6.8% versus 19%); 1.6 times less likely to work in natural- and applied-science occupations (4.3% versus 7.1%); and 1.2 times less likely to work in business, finance, and administration occupations (16.1% versus 19.5%).
Figure 6 illustrates the greater and lesser likelihood for independent-school parents to work in each of the ten broad NOC categories, and table 1 summarizes the broad NOC category survey responses and their respective share of respondents in the labour market and of total respondents.
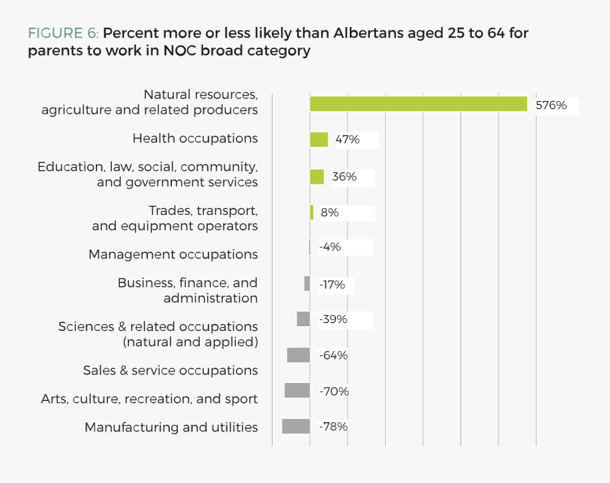
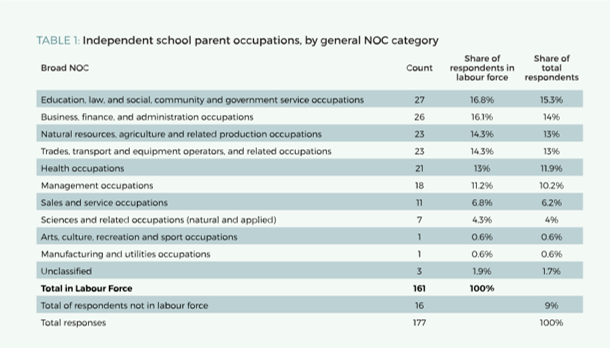
Table 2 presents the top twenty specific occupations, by NOC, for independent-school parents.3 The most common independent-school-parent occupation is secondary- and elementary-school teachers and educational counsellors, at 11.2 percent of independent-school parents in the labour force compared to 2.9 percent of twenty-five- to sixty-four-year-old Albertans in the labour force (Statistics Canada 2019; 2020b).4 Agriculture or horticulture worker is the second most common occupation (8.7% versus 0.5%), followed by professional occupations in nursing (5.6% versus 2.5%). In other words, Alberta independent-school parents are nearly four times more likely to be teachers, nineteen times more likely to be farmers, and more than twice as likely to be nurses.
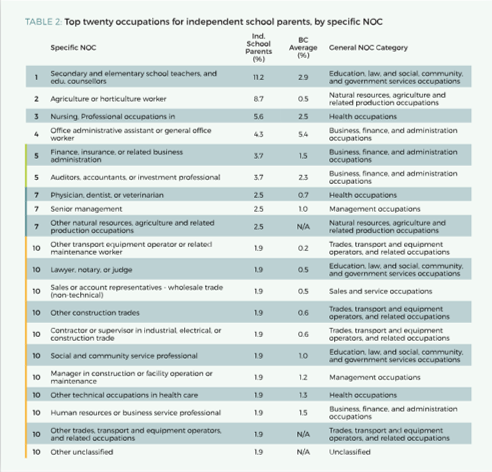
There are nine other occupations in which independent-school parents are particularly overrepresented. In order of greatest likelihood: these parents are 11 times more likely to select “other” transport equipment operator or related maintenance worker as their occupation (1.9% versus 0.2%); 4 times more likely to be a lawyer, notary, or judge (1.9% versus 0.45%); 3.6 times more likely to be a non-technical wholesale trade sales or account representative (1.9% versus 0.52%); over 3 times more likely to be physicians, dentists, or veterinarians (2.5% versus 0.75%); 3 times more likely to work in “other” construction trades (1.9% versus 0.6%); three times more likely to be a contractor or supervisor in industrial, electrical, or construction trades (1.9% versus 0.63%); over 2.5 times more likely to be in senior management (2.5% versus 0.98%); nearly 2.5 times more likely to work in finance, insurance, or related business administration (3.7% versus 1.5%); and nearly twice as likely to be a social and community service professional (1.9% versus 1%).

The only profession in the top twenty in which independent-school parents have a lower likelihood to be employed than other Albertans is the fourth-ranked occupation: office administrative assistant or general office worker (4.3% versus 5.4%). Rounding out the top twenty, Alberta independent-school parents are approximately 1.6 times more likely to be auditors, accountants, or investment professionals (3.7% versus 2.3%); 1.5 times more likely to be managers in construction or facility operation or maintenance (1.9% versus 1.2%); nearly 1.5 times more likely to work in “other” technical occupations in health care (1.9% versus 1.3%); and 1.3 times more likely to be a human-resources or business-service professional (e.g., marketing consultant) (1.9% versus 1.5%).
It is also interesting to compare these results to the recent BC and Ontario survey results. As shown in table 3, the top occupation is identical for all three provinces: secondary- or elementary-school teacher, or educational counsellor. Three other top five occupations are also identical between Alberta and Ontario, as well as two in BC: professional occupations in nursing (ranked third in Alberta and second in Ontario); office administrative assistant or general office worker5 (fourth Alberta, third Ontario, third BC); occupations in finance, insurance, or related business administration (fifth Alberta, fifth Ontario); and auditors, accountants, or investment professionals (fifth Alberta, sixth Ontario, second BC). With the exception of workers in agriculture or horticulture, all of the seven most common Alberta independent-school-parent occupations are in the top five of either BC, Ontario, or in some cases both. There is, however, an important difference in the presentation of unclassified responses. Alberta survey respondents, in open-ended responses, provided considerably more clarity in specifying what they meant by “unclassified” or “not applicable.” Three unclassified responses are of respondents in the labour market, but 8.5 percent of respondents (15/177) are full-time parents not presently in the labour force.6
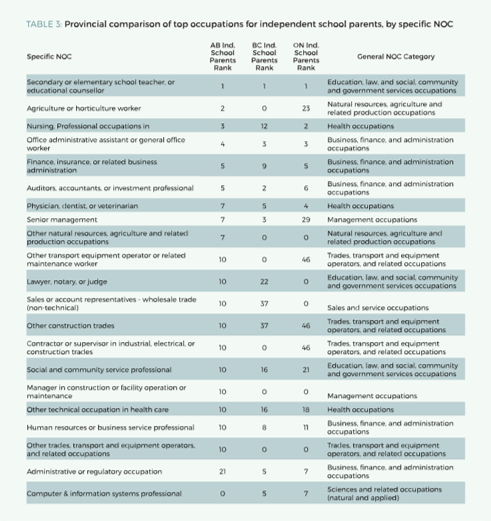
An important observation is how “middle class” the occupations of independent-school parents are across the country. Although economists prefer to define the middle class by income, wealth, or consumption, and other disciplines may define it by culture or even education or power, sociologists define class by occupational status (Reeves, Guyot, and Krause 2018), and in this respect, independent-school parents are overwhelmingly middle class.
INCOME AND FAMILY STRUCTURE
Marriage correlates positively with income (Sarlo 2019; Milke 2017; Wang and Wilcox 2017; Chetty et al. 2014; Murray 2013; Haskins and Sawhill 2003), so family structure needs to be explored before discussing earnings.
Independent-school households are more likely to be married, two-parent families. Specifically, 95.6 percent of respondents are two-parent families, and 93 percent are married-couple families, compared to 76 percent and 71.8 percent, respectively, of Alberta private-household families with children (Statistics Canada 2017; Mrozek and Mitchell 2018). (This is very similar to the findings in BC and Ontario [Hunt and Van Pelt 2019; Van Pelt, Hunt, and Wolfert 2019https://www.cardus.ca/research/education/reports/who-chooses-alberta-independent-schools-and-why/#_ftn8" id="_ftnref8" style="box-sizing: border-box; background-color: transparent; color: rgb(66, 250, 251);" title="">8
This is consistent with the findings in MacLeod, Parvani, and Emes (2017). Using Ministry of Education and Statistics Canada data – linking Alberta independent-school families’ postal codes to the census dissemination area – they find the average after-tax family income for non-elite independent school households is $95,549, compared to $97,301 for the average government-run school family in Alberta. For non-elite independent schools with a religious affiliation, the average falls to $91,990 – less than half that of elite schools ($192,265). This is a critical distinction, as over 60 percent of Alberta’s independents are religious schools (Allison, Hasan, and Van Pelt 2016), and less than 20 percent of Alberta’s independents are elite (MacLeod, Parvani, and Emes 2017). In other words, the overwhelming majority of Alberta independent school families earn less than the aver-age government-run school family, but the few who attend elite schools earn substantially more—enough to considerably skew the overall average.
PAYING FOR SCHOOL
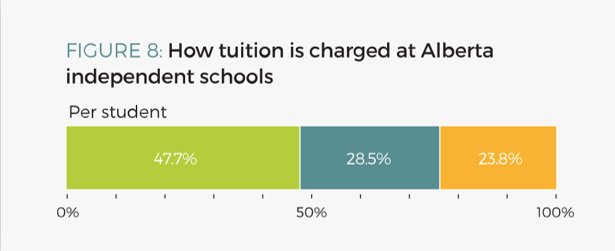
Tuition is charged in one of three primary ways—per student (47.7%), per family (28.5%), and sliding scale (23.8%)—and tuition costs vary considerably, as figure 8 shows. When broken down on a per-student, per-year basis, tuition ranges from $120 to $20,000. On average, Alberta independent-school parents pay $4,000 (median) per student per year.
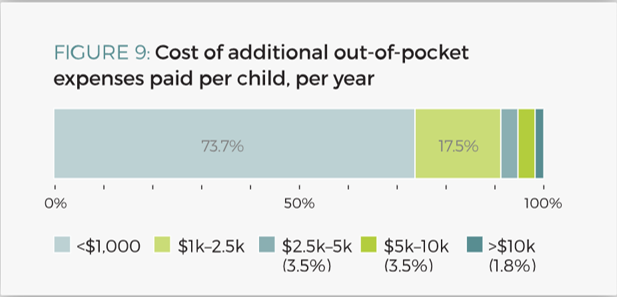
But as shown in FIGURE 9, tuition is not the only out-of-pocket parent expense. In addition to tuition, 73.7 percent (126/171) spend under $1,000 annually per child on extra costs (such as uniforms, instruments, tutors, school trips, or activity fees), 17.5 percent (30) spend $1,000 to $2,500, 3.5 per-cent (6) spend $2,500 to $5,000, another 3.5 per-cent (6) spend $5,000 to $10,000, and the remaining 1.8 percent (3) spend over $10,000 in extras.
In addition, 5.2 percent (nine respondents) pay residence fees. Of these nine respondents, seven pay less than $4,000 annually per student, and two pay between $4,000 and $8,000.
For perspective, the average Canadian parent with a child in hockey spends nearly $3,000 per child per season; this average increases to $3,700 per season for children over ten years old (Mirtle 2013). Moreover, an Ipsos survey found that 32 percent of Canadian parents go into debt to pay for their children’s extracurricular activities, averaging $1,160 annually (Alini 2018). Although independent-school parents may pay for the same extracurriculars, the context of these price points shows that independent schooling is likely within reach of more families than often assumed.

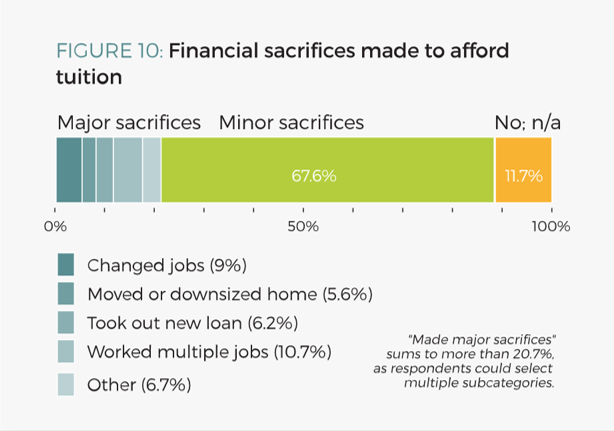
Yet, affording tuition can be a challenge. Fully 88 percent of parents (157/178) have made financial sacrifices to afford the cost of independent schooling, and over 20 percent (36) have made major financial sacrifices—as defined by working multiple jobs, changing jobs, taking out a new loan, or moving or downsizing their house. Those who work multiple jobs to cover the cost of schooling make up 10.7 percent (19), 9 percent (16) changed jobs to afford it, 6.2 percent (11) have taken out a new loan, and 5.6 percent (10) have moved or downsized their home, as figure 10 displays.
CIVIC ENGAGEMENT
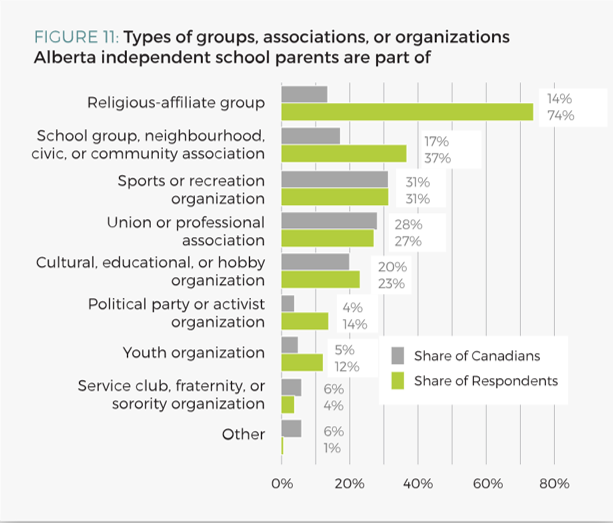
Independent-school families are more engaged in their communities than Albertans as a whole. Fully 98 percent of respondents (169 of the 173 that finished the survey) are active in a group, organization, or association, compared to 70 percent of Albertans (Turcotte 2015), and on average, independent-school parents are members of at least two groups, organizations, or associations. The most common involvement is with a religiously affiliated group, at 74 percent, which is over five times the national average (14%), as presented in figure 11.9 However, when excluding religious-school families, religiously affiliated group membership—at 4 percent—is less than one-third the Canadian average of 14 percent.
Involvement in a school group, neighbourhood, civic, or community association (e.g., parent-teacher association, alumni association, or block parents) is the second highest type of involvement reported, at 36.7 percent, which is slightly double Statistic Canada’s 17 percent. Sports and recreation is third, matching the national average, at 31 percent (the highest of any group, organization, or association in the General Social Survey). Alberta independent-school parents are neither more nor less likely to be members of a union or professional organization (27% versus 28%); moderately more likely to be members of a cultural, educational, or hobby organization (23% versus 20%); 3.6 times more likely to be involved in a political party or activist organization (14.2% versus 4%); and more than twice as likely to be involved in a youth organization (11.8% versus 5%).
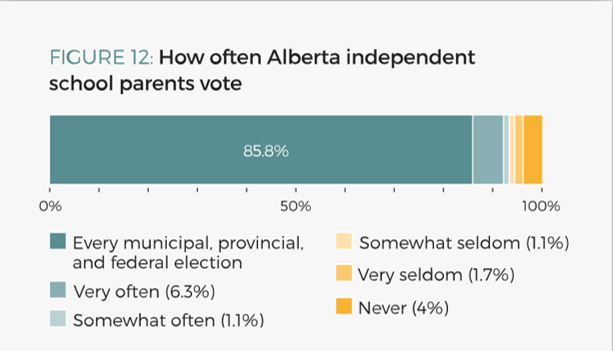
In terms of voting, 86 percent (151/176) of independent-school parents participate in every municipal, provincial, and federal election. This is 25 and 20 percentage points higher than their BC and Ontario peers, respectively, but the remaining voter-participation findings are near identical across the three provinces. Fully 93 percent (164) of Alberta independent-school parents vote at least somewhat often. Only 4 percent (7) never vote, which is at least a quarter less than the national average.
For context, the average voter turnout in the last five federal and Alberta provincial elections was 62.8 percent and 52.9 percent, respectively (Elections Canada 2015; 2018; Elections Alberta 2020). The highest voter turnouts on record were the 1958 federal election and 1935 Alberta provincial election at 79.4 percent and 81.8 percent, respectively. At the municipal level, Calgary’s 58.1 percent voter turnout in 2017 was the highest in four decades. The last time Edmonton had similar turnout for a municipal election was in 1992, at 52 percent. In 2007, Edmonton’s municipal voter turnout was just 27 percent (Clancy 2017). In other words, Alberta independent-school parents are considerably more likely to vote in any given election, as figure 12 shows.
The greater likelihood of independent school parents to participate in civic activities, such as community organizations and elections, is a critical finding. This study indicates that independent-school families have a culture of considerably greater civic engagement than Albertans in general. This finding calls into question an argument that is sometimes made against independents schools, especially religious schools: that adverse social outcomes will result if all students do not receive the same “common school” education. Instead, this study suggests that independent-school families contribute actively to society’s shared social and democratic life. This greater civic engagement adds to a growing body of evidence from North America’s largest sample of independent-school-graduate outcomes, the Cardus Education Survey, in which similar findings were observed (Pennings et al. 2011; 2012; 2014; Green et al. 2016; Green, Sikkema, and Sikkink 2018a; 2018b).
RELIGIOUS AFFILIATION
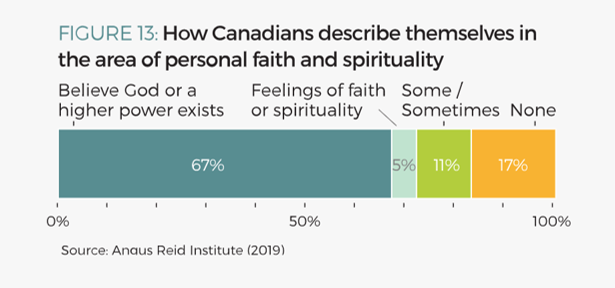
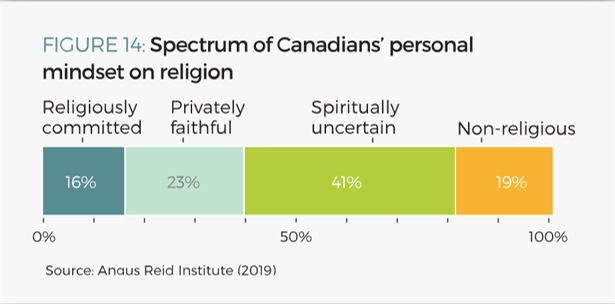
In partnership with Cardus, the Angus Reid Institute recently carried out a survey of 2,055 Canadians, which found that 17 percent report having no faith feelings or spirituality compared to 67 percent who report a belief in God or a higher power, as presented in figure 13 (Angus Reid Institute 2019). Fully 19 percent of Canadians identify as non-religious, 41 percent express spiritual uncertainty, 23 percent are privately faithful, and 16 percent are religiously committed (figure 14). Interestingly, the Angus Reid Institute study found that exactly two-thirds of Canadians consider themselves Christian, including 64 percent of the spiritually uncertain, and 32 percent of the non-religious. Fully 68 percent of Canadians rarely or never attend religious services (other than weddings or funerals). In other words, even though a minority of Canadians are active in organized religion (12% attend religious services at least weekly), the overwhelming majority of Canadians identify as spiritual or with a religion of some kind. This religious affiliation is even more pronounced in independent schools—both religious and non-religious independent schools.
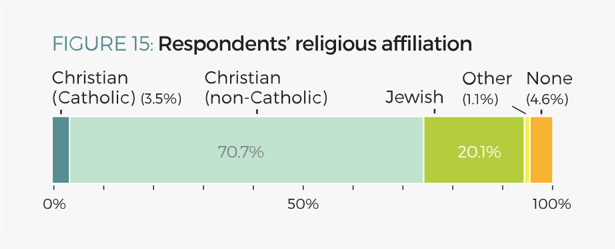
A total of 95.4 percent (166/174) of Alberta survey participants report a religious affiliation, with only 4.6 percent (8) selecting “None,” as shown in figure 15. Even in non-religious independent schools the overwhelming majority, 70 percent, self-identify as religious—identical to the findings in Ontario and similar to BC. Of total Alberta respondents, 74 percent (129) identify as Christian—the largest category—compared to 67 percent of all Canadians. By school category, 45 percent and 78.4 percent of non-religious and religious independent-school families identify as Christian, respectively. Jewish families are also generously represented in the Alberta sample, making up 15 percent and 21 percent of non-religious- and religious-school respondents, respectively.10
SCHOOL-TO-SCHOOL MOBILITY
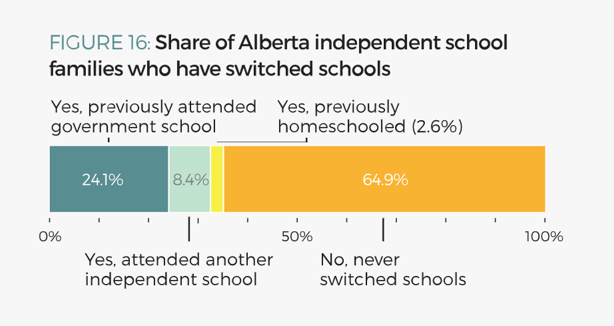
Figure 16 presents the school-to-school mobility of Alberta’s independent-school families. Of 228 participating families, 35 percent (80) had enrolled previously in another school. This is 13 percentage points lower than the 47 percent reported for both BC and Ontario. Of all the Alberta respondents, 24 percent (55) have had at least one child attend a government-run school at some point, and 2.6 percent (6) have homeschooled. Thus, 73 percent (167) have attended only independent schools. There is minimal difference between non-religious- and religious-independent schools in likelihood to switch schools or to have previously attended a government-run school. Of the combined eighty families that had previously enrolled elsewhere, 69 percent (55) have had children attend government-run school. This is an important finding. In other words, of families currently enrolled in independent school, for every one that switched from another independent school, two came from a government-run school. (In BC and Ontario, the ratio is three to one.)
The Alberta results’ divergence from the near-identical findings in BC and Ontario in 2019 and Ontario in 2007 is worth noting.11 Two things likely explain Alberta independent-school parents’ lower likelihood to switch schools. First, Alberta independent-school parents are 3 times more likely than their BC peers and twice as likely as their Ontario peers to have themselves attended their child’s independent school. Second, Alberta independent-school parents are nearly 10 times and 1.5 times more likely than their BC and Ontario counterparts to live in a rural setting. It is likely that rural families have fewer alternatives, if any, to choose among—especially if a religious family is interested in enrolling only in a school of their particular creed.
Parental Reasons for Choosing Independent Schools
The review of Van Pelt, Allison, and Allison (2007) of the North American literature revealed sixty-one independent-school characteristics, which, through testing, Hunt (2019) refined to forty-seven. For this study, Alberta parents were asked, using a four-point scale for each characteristic, the extent to which they agree or disagree that each item influenced their choice of independent school. The questionnaire also asked about the most important reason (possibly outside the forty-seven), external influencers, and parental satisfaction. This section presents these findings and an analysis of why parents choose Alberta independent schools.
RANKING THE REASONS WHY PARENTS CHOOSE INDEPENDENT SCHOOLS
Van Pelt, Allison, and Allison (2007) ranked Ontario independent-school parents’ top ten reasons based solely on “very important” responses. However, the rankings vary greatly—overall, and by school type—when “somewhat important,” “somewhat unimportant,” and “not important” responses are factored in. For example, if ranking is based solely on “very important” responses, “This school reinforces our faith or religious beliefs” ranks sixth overall, due to the intensity of its importance (that is, those who consider it important are much more likely to select “very important” instead of “somewhat important”), even though this factor is likely irrelevant to most, if not all, of the non-religious-school families.
Thus, to better reflect the full spectrum of parent perspectives as a whole, the responses of “very important” and “somewhat important” are added together, and the responses of “somewhat unimportant” and “not important” are subtracted. Double weight is given to the strong-intensity sentiment of “very important” and “not important.” The provincial distribution of each school type is also factored in (36% weighting for the share of non-religious-school students and 64% religious, to reflect their respective share of the Alberta independent school sector as a whole). After applying these weights, “This school reinforces our faith or religious beliefs” moves down the rankings, from sixth to thirty-sixth place, which more accurately reflects the fact that it is unique to religious schools.
Table 4 presents the weighted overall top twenty, and table 5 and table 6 give the sector-specific top-ten ranking for non-religious- and religious-independent-school respondents, respectively. “This school offers a supportive, nurturing environment for students” is ranked first overall and is also the only response ranked in the top five across school type. Second overall is “This is a safe school,” ranking third for religious-independent-school parents and seventh for non-religious. In third place overall is “This school instills confidence in the students,” ranking first for non-religious and fifteenth for religious. In fourth place comes “The students at this school seem happy,” which is second for non-religious and seventeenth for religious. Rounding off the overall top five is “This school emphasizes character development,” which ranks seventh for both non-religious- and religious-independent-school parents.
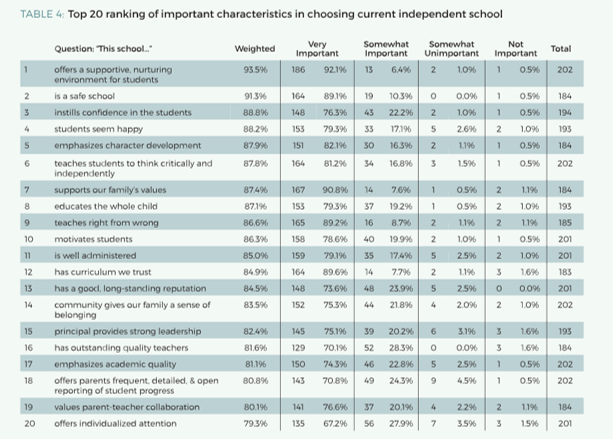
The top five overall results in table 4 are similar to those in the other provinces. Four of BC’s top five and three of Ontario’s top five rank in the top five for Alberta parents. The top two across all three provinces are “Supportive, nurturing environment” and “School safety.” “Character development” ranks third for BC and Ontario but falls to fifth in Alberta. And BC’s fourth-place rank moves up to third in Alberta: “Instills confidence in students” (which is ranked sixth in Ontario). Only one of the overall top-five characteristics is unique to Alberta: “Student happiness” is ranked fourth in Alberta, ninth in BC, and fourteenth in Ontario.
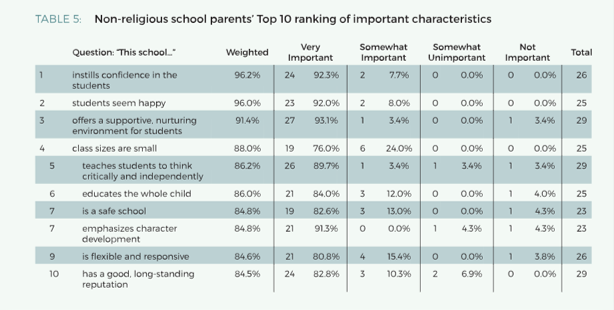
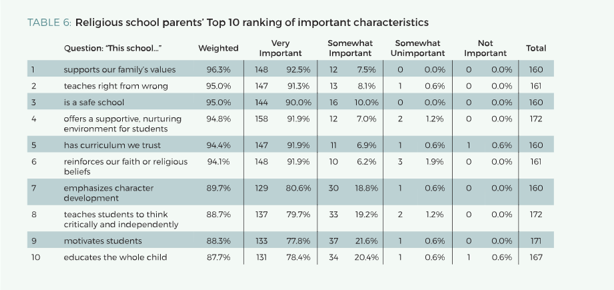
It is worth noting two other characteristics that appear in the top ten for both non-religious- and religious-independent-school parents. “This school teaches students to think critically and independently” ranks sixth overall, fifth for non-religious, and eighth for religious. And “This school educates the whole child” ranks eighth overall, sixth for non-religious, and tenth for religious.
As in BC and Ontario, academic emphasis ranks lower than what one might expect. “This school emphasizes academic quality” lies outside of the top ten for both school types, ranking seventeenth overall, twenty-fourth for non-religious, and thirteenth for religious. This appears to be a decades-long trend. In a 1978 survey of BC independent-school parents, Kamin and Erickson (1981) found that strict discipline and academics were by far the most important reasons for parents choosing non-religious independent schools. By 2002, Bosetti’s survey of Alberta independent-school parents found that smaller class size, shared values and beliefs, and teaching style were all more important to non-religious-independent-school parents than academic reputation (Bosetti 2004). A few years later, the Alberta survey of Bosetti and Pyryt (2007) and the Ontario survey of Van Pelt, Allison, and Allison (2007) of independent-school parents found that academics were important to nearly all parents. In the latter study, “This school emphasizes academic quality” ranked second and sixth for academically defined and religiously defined schools, respectively. But more recently, the surveys of Georgia independent-school parents by Kelly and Scafidi (2013) and the Florida survey of independent-school parents by Bedrick and Burke (2018) confirm a decreasing importance of academic emphasis in parents’ school choice. In the latter, student performance on standardized tests was the least important factor for parents. These findings challenge the common assumption, often made in studies comparing school results, that the primary motivation of parents choosing an independent school is academics. Not that academic quality is unimportant; for a nation and economy, it is vitally important. But at present, academic quality is not the primary factor for most Albertan, British Columbian, and Ontarian parents’ independent-school choice.
WHAT WAS NOT IMPORTANT
Some of the forty-seven factors have little importance to parents. The factor “This school is less expensive than others we considered” ranks last (forty-seventh), as it is “very important” to the fewest parents (10.2%) and is “not important” to the largest share of parents (41.2%). Including “somewhat unimportant” responses, it is unimportant to over two-thirds (68.5%) of Alberta independent-school parents. Ranking second and third lowest are “geographic proximity to home” (forty-sixth) and “convenient transportation options” (forty-fifth), which are unimportant to 64.4 percent and 47 percent of respondents, respectively. Rounding off the bottom five are “additional activities before and/or after regular classes” (forty-forth) and “regularly assigned homework” (forty-third). Just outside the bottom five, ranking forty-second, is “Other members of our family typically attend this school or one like it,” which ranks last in both BC and Ontario. Including the latter, six of Alberta’s seven lowest-ranked reasons are also in the bottom seven of the two other provinces. The only factor that is not in the lowest seven for all three provinces is “Broad appreciation for the arts and culture” (forty-first in Alberta, thirty-sixth in BC, thirty-fourth in Ontario). Alberta’s bottom rankings, however, are all in different order, whereas the seven lowest-ranked in BC and Ontario are identical and in identical order to each other.

THE MOST IMPORTANT REASON FOR CHOOSING INDEPENDENT SCHOOL
When asked open-endedly for the most important consideration in choosing their independent school, 38.6 percent (66) gave a single reason. The remaining 61.4 percent (105) stated a combination of factors. The most common “most important” reason given was that “it reinforces our faith or religious beliefs,” followed by “the school supports our family’s values.” Many of these parents make specific reference to the fact the school is Christian or Jewish. For some, this is not to “reinforce” their religion, but rather—openly stating they are not a religious family—because they see great value in a faith-based education. Others state factors such as the sense of community, shared heritage or culture, atmosphere, caring teachers, or safety as the priority in choosing a religious or faith-based school. From one-word responses to lengthy paragraphs, the rationales for choosing a school that is “religious,” “faith-based,” “Christian,” or “Jewish” vary considerably.
It is interesting to note the difference between a large list of important characteristics (table 5) and “most important” characteristic. The top two table 5 rankings—“This school offers a supportive, nurturing environment for students,” and “This is a safe school”—fall considerably lower when asked open-endedly for the most important reason. (This is observable in the BC and Ontario data as well.) There are many examples of this. Most notably, 96.4 percent and 95.3 percent of parents believe it is important that their school’s “Students seem happy” and that their “school’s principal provides strong leadership,” ranking fourth and fifteenth in table 5, respectively, and yet not a single parent considers either “most important.” Conversely, “This school reinforces our faith or religious beliefs” ranks thirty-sixth in the table 5 dataset (too low to even appear in the table’s presentation of the data) but rises to first in open-ended responses. To those to whom it is important, it is highly likely to be most important.
EXTERNAL INFLUENCES ON PARENTS’ CHOICE
Another reason that parents choose a particular independent school is the sources that influence their decision. Table 7 shows how parents first heard of their school, and table 8 presents the sources that strongly influenced their decision. “Parent attended school” is the most common response to how parents first heard about the school and the third most likely source to strongly influence their choice, at 30 percent (55/183) and 20.4 percent (70/343), respectively. Second most common for both is “Church / synagogue / temple / mosque” at 27.3 percent (50) and 24.8 percent (85), respectively. “Friends or relatives” is the third most common response and the most likely source to strongly influence their choice, at 26.2 percent (48) and 29.7 percent (111). If we combine all of these word-of-mouth responses”friends or relatives” with “other word-of-mouth” and “reputation,” total word-of-mouth led to 30 per cent of independent-school parents first hearing about their school and strongly influenced 34 per cent in their school choice.”
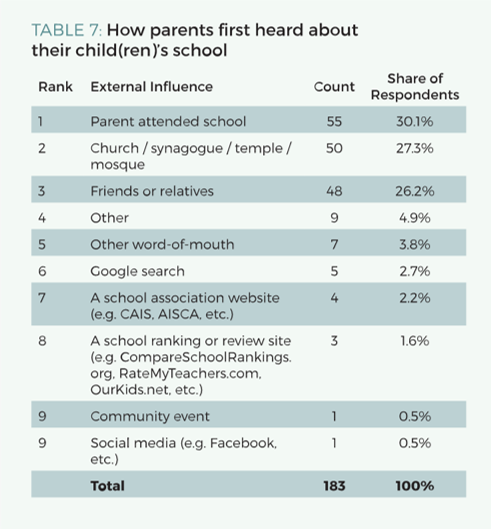
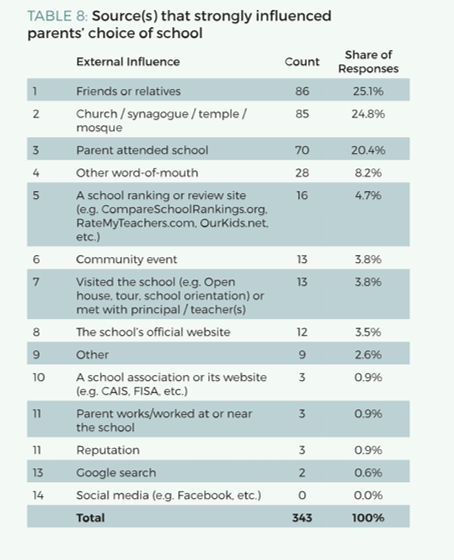
The results in table 7 and table 8 are quite different from both BC and Ontario independent-school parents. By a considerable margin, the top-ranked reason for both tables in BC and Ontario is friends and relatives. All types of word-of-mouth combined is how 60 percent of BC parents and 46.3 percent of Ontario parents first heard about their independent school and what strongly influenced 43.4 percent and 41.6 percent, respectively. Conversely, Alberta parents are 3 times more likely to first hear about their independent school through “Church / synagogue / temple / mosque,” which is approximately 2.5 times more likely to strongly influence their decision, compared to BC and Ontario parents. And as presented earlier, Alberta parents are 3 times more likely than BC parents and twice as likely as Ontario parents to have attended the same school as their child; accordingly, it is higher ranking in both tables for Alberta.
SATISFACTION
Figure 17 indicates Alberta parents’ satisfaction with their independent schools. On a scale from one to ten, 55 percent (95/173) are “10/10” extremely likely to recommend their child’s independent school to a friend, neighbour, or colleague. Likewise, 15.6 percent (27) and 10.4 percent (18) selected 9/10 and 8/10, respectively. Combined, 81 percent (140) of independent-school parents are likely to promote their independent school (8/10 to 10/10), 14 percent (24) are passive (5/10 to 7/10), and 5 percent (9) unlikely to recommend their school. The lowest response was 0/10 (3).

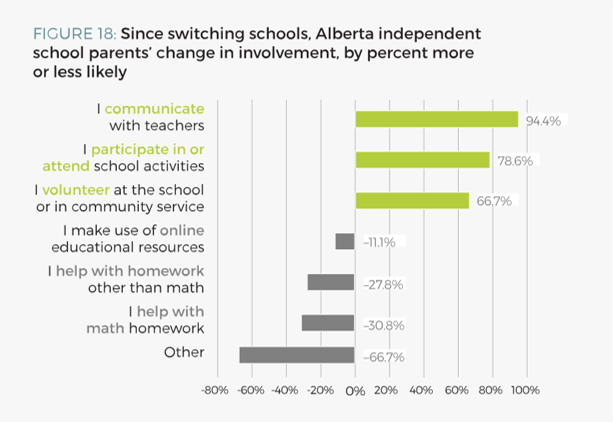
Since switching from a government-run to an independent school, 94.4 percent of parents communicate more often with teachers (compared to 54.4% and 68.2% in BC and Ontario), 78.6 percent participate in or attend school activities more often (versus 47.2% in BC and 61.8% in Ontario), and exactly two-thirds volunteer at the school or in community service more (versus 35.6% in BC and 45.8% in Ontario), as shown in figure 18. Also, Alberta parents are considerably less likely to have to help with homework, after switching from a government-run to independent school (this is not the case in BC or Ontario).
Conclusion and Implications
In conclusion, independent schools provide a place where parents can follow their pedagogical, philosophical, and religious convictions for the education of their children. Independent-school parents are more likely to be well-educated and contributing members of society, but given the fact they are mostly middle-class Albertans who make financial sacrifices to afford tuition on a below-average income, “elite” and “highly privileged” stereotypes are counterfactual. They overwhelmingly do not attend independent school for status, connections, or academic advantage. Alberta parents choose independent schools for a supportive, nurturing, and safe educational environment that matches their values and instills confidence and character in students. As these families—and the dynamic expansion of the independent-school sector—make clear, they are overwhelmingly satisfied with their decisions.
The findings have implications for the independent-school community, as they provide a clearer focus on what their parents value. In addition to the aforementioned, there are at least three key takeaways. First, academics, extracurriculars, and facilities are not parents’ highest priorities. Second, parents may not be as price-sensitive to tuition as assumed, since they are willing to make considerable financial sacrifices to make it work. And third, school growth does not come from sophisticated marketing but by word of mouth. Therefore, independent schools’ care for their students and families, by providing an atmosphere and community that is nurturing, supportive, and safe—in other words, one where families want to be, and one they trust—is the most important thing, and will lead to the word-of-mouth referrals that will generate future growth.
There are also broader implications for the province. Alberta’s independent schools meet needs unmet by the other important institutions within Alberta’s pluralistic education system. Moreover, Alberta’s independent schools provide meaning and value to students and families that enrich not only the independent school community but society as a whole.
Appendix: Methodology
This research series aims to replicate Van Pelt, Allison, and Allison (2007), from a pan-Canadian perspective, while being heavily informed by the most current research on why parents choose independents schools.
Survey Design
Following Van Pelt, Allison, and Allison’s approach, many questions are based on the 2016 Census and 2013 General Social Survey to understand participating families’ demographic information, so that the results can be readily compared for analysis (Van Pelt, Allison, and Allison 2007, 14). This tells us the “who.” To know “why” parents choose, Van Pelt identified 61 independent school characteristics from examining the North American literature—specifically: Bell (2005), Bosetti (2000), Community-University Partnership for the Study of Children, Youth and Families (2004), Davies and Quirke (2005a; 2005b), Erickson (1986), Mirski (2005), Paquette (2000), and Ungerleider (2003), among others. On a four-point scale for each, Van Pelt’s questionnaire asked parents two questions: the extent to which they agreed or disagreed that each characteristic influenced their school choice, and whether it was a feature in their independent school (Van Pelt, Allison, and Allison 2007, 23). Based on the original Van Pelt, Allison, and Allison (2007) study, a pilot questionnaire was created in 2018 with an updated list of independent-school characteristics to reflect the most recent literature. The pilot found no distinction between the reasons for choosing a school and its features. Some terminology was problematic too. Pilot respondents were uncomfortable identifying as “elite,” so the term “university preparatory” is substituted in the survey. The pilot respondents also found too much similarity between the questions, so a second and third test survey were conducted to further refine the list. The pilot took respondents close to sixty minutes to complete and was refined to an average completion time of eighteen minutes, without losing its essence, before outreach.
Sampling
To ensure a representative sample of the Alberta independent-school sector, the process began with an extensive stratification of all Alberta independent schools into their respective school associations (many schools are members of multiple associations) and one of three broad categories: university preparatory, specialty, or religious. Of note, many schools do not easily fit into one category, either because they are unique or match the description of multiple categories (e.g., Islamic Montessori, non-CAIS preparatory). Each school is also labelled by region, neighbourhood type, and grades offered (e.g., ECS-12, elementary only, secondary only).
Data Collection and Challenges
Using the parameters described above, thirty-one schools were randomly selected that, assuming a similar response rate, would proportionately reflect the landscape of Alberta independent-school and estimated student populations. Each randomly selected school was contacted, via email then phone, and asked to invite its entire school-parent population to participate in the online survey. If the head of school or governing body agreed, they were emailed an online package to electronically distribute to the parents in their school(s). If a school declined to participate, an additional comparable school was randomly selected from the respective stratum and approached.
It took considerable outreach, however, to confirm participation or rejection, and two competing forces further limited engagement. School outreach began November 6, 2019. The following day, the Alberta government released its own online survey to poll the population on choice in education (Alberta 2019a). When asked to participate in our study, most principals declined, stating that participation in the government study took priority. Many said to try again in the spring. However, the COVID-19 lockdown interrupted the opportunity for spring outreach.
The survey link was closed March 27, 2020. Of a total seventy schools contacted, eighteen agreed to participate in the study.
The online survey was administered, and the data collected, through Survey Monkey, and analysis was conducted in Qualtrics. All participating parents and schools remain private, confidential, and anonymous.

Limitations
In addition to the challenges with data collection due to the unique circumstances of the 2019–20 school year, a major limitation of this study is potential response bias in three areas. Although the schools are randomly selected, parents within the invited school population are self-selected. Self-selection bias is thus an unavoidable limitation, as parents with stronger views may be more compelled to respond than others. Second, demographics may bias results, as parents of greater and lesser means may have more or less time or willingness to complete the questionnaire. Last, no government-school parents are surveyed, only current independent school parents, so movement from independent to government-run school is unaccounted for and possible negative views from former independent school families missed.
An additional limitation is a lack of participation from two religious independent schools, representing two other religions, who agreed to participate in the study but never sent the survey link out to their school’s parents. The COVID-19 closures eliminated any further opportunity for follow-up or additional outreach to new schools. These schools’ non-participation significantly affects the representativeness of the sample—in particular, for questions pertaining to religion.
In conclusion, these Alberta findings should be viewed as provisional. Given the findings are similar (but with some important exceptions) to what was found in BC and Ontario, however, further research will likely confirm these initial findings. Further research is needed.
References
Alberta Education. 2020. “Alberta Schools and Authorities.” https://education.alberta.ca/alberta-education/school-authority-index/everyone/alberta-schools/.
Alberta, Government of. 2019a. “Seeking Input on Education Choice.” November 7. https://www.alberta.ca/release.cfm?xID=65044C60F86B7-BE1D-5ABD-C127BAA98C4DEC4B.
———. 2020a. “Private Schools.” https://www.alberta.ca/private-schools.aspx.
———. 2020b. “Student Population Statistics.” https://www.alberta.ca/student-population-statistics.aspx.
Alini, Erica. 2018. “Hockey? Swimming? Here’s How Much Parents Spend on Extracurricular Activities: Ipsos.” Global News, September 4. https://globalnews.ca/news/4400116/extracurricular-activities-cost-canada-swimming-hockey/.
Allison, Derek. J., Sazid Hasan, and Deani Van Pelt. 2016. A Diverse Landscape: Independent Schools in Canada. Fraser Institute.
Angus Reid Institute. 2019. “Freedom of Religion Widely Valued in Canada, But the Role of Faith in Society Still a Source of Debate” December 4. http://angusreid.org/freedom-of-religion/.
Bedrick, Jason, and Lindsey Burke. 2018. Surveying Florida Scholarship Families: Experiences and Satisfaction with Florida’s Tax-Credit Scholarship Program. EdChoice, October 30. https://www.edchoice.org/research/surveying-florida-scholarship-families/.
Bell, C. A. 2005. All Choices Created Equal? How Good Parents Select “Failing” Schools. New York: National Centre for the Study of Privatization in Education.
Bosetti, Lynn. 2000. “Alberta Charter Schools: Paradox and Promises.” Alberta Journal of Educational Research 46, no. 2:179–90.
———. 2004. “Determinants of School Choice: Understanding How Parents Choose Elementary Schools in Alberta.” Journal of Education Policy 19, no. 4:387–405. doi:10.1080/0268093042000227465.
Bosetti, Lynn, and Michael C. Pyryt. 2007. “Parental Motivation in School Choice.” Journal of School Choice 1, no. 4:89–108. doi:10.1300/15582150802098795.
Chetty, Raj, Nathaniel Hendren, Patrick Kline, and Emmanuel Saez. 2014. “Where Is the Land of Opportunity? The Geography of Intergenerational Mobility in the United States.” Quarterly Journal of Economics 129, no. 4:1553–1623.
Clancy, Clare. 2017. “Municipal Election Sees Mediocre Voter Turnout While More Residents Opt for Advance Polls.” Edmonton Journal, October 17. https://edmontonjournal.com/news/local-news/municipal-election-sees-mediocre-voter-turnout-while-more-residents-opt-for-advance-polls.
Clemens, Jason, Joel Emes, and Angela MacLeod. 2018. “K–12 Education Reform in Alberta.” Fraser Institute. https://www.fraserinstitute.org/sites/default/files/K-12-education-reform-in-alberta.pdf.
Community-University Partnership for the Study of Children, Youth and Families. 2004. Choice and Accountability in Canadian Education. Edmonton: University of Alberta.
Davies, S., and L. Quirke. 2005a. “Innovation in Educational Markets: An Organizational Analysis of Private Schools in Toronto.” Catholic Education 8, no. 3:274–305.
———. 2005b. “Providing for the Priceless Student: Ideologies of Choice in an Emerging Educational Market.” American Journal of Education 111, no. 4:523–47.
Doyle, Denis P., Brian Diepold, and David A. DeSchryver. 2004. “Fwd: Where Do Public School Teachers Send Their Kids to School?” Thomas B. Fordham Institute, September 7. https://fordhaminstitute.org/national/research/fwd-where-do-public-school-teachers-send-their-kids-school.
Elections Alberta. 2020. “Overall Summary of Ballots Cast and Voter Turnout 1975–2019.” https://www.elections.ab.ca/election-results/overall-summary-of-ballots-cast-and-voter-turnout/.
Elections Canada. 2015. “42nd General Election 2015: Official Voting Results.” https://www.elections.ca/res/rep/off/ovr2015app/41/table4E.html.
———. 2018. “Voter Turnout at Federal Elections and Referendums.” August 27. https://www.elections.ca/content.aspx?section=ele&dir=turn&document=index&lang=e.
Erickson, D. 1986. “Choice and Private Schools: Dynamics of Supply and Demand.” In Private Education: Studies in Choice and Public Policy, edited by D. C. Levy, 82–109. New York: Oxford University Press.
Green, Beth, Doug Sikkema, and David Sikkink. 2018a. “Cardus Education Survey: British Columbia Bulletin.” Cardus. https://www.cardus.ca/research/education/reports/cardus-education-survey-2018-british-columbia-bulletin/.
———. 2018b. “Cardus Education Survey: Ontario Bulletin.” Cardus. https://www.cardus.ca/research/education/reports/cardus-education-survey-2018-ontario-bulletin/.
Green, Beth, Doug Sikkema, David Sikkink, Sara Skiles, and Ray Pennings. 2016. “Cardus Education Survey: Educating to Love Your Neighbour.” Cardus. https://www.cardus.ca/research/education/reports/cardus-education-survey-2016-educating-to-love-your-neighbour/.
Haskins, Ron, and Isabel Sawhill. 2003. Work and Marriage: The Way to End Poverty and Welfare. Welfare Reform and Beyond 28. Washington, DC: Brookings Institution.
Hunt, David N. 2019. “Independently-Managed Education: Creating a Robust Education Market by Understanding School Choice Families.” Master’s thesis, School of Public Policy, Simon Fraser University.
Hunt, David, and Deani Van Pelt. 2019. “Who Chooses Independent Schools in British Columbia and Why?” Cardus. https://www.cardus.ca/research/education/reports/who-chooses-independent-schools-in-british-columbia-and-why/.
Kamin, Jonathan, and Donald A. Erickson. 1981. “Parent Choice of Schooling in British Columbia: Preliminary Findings.” Institute for the Study of Private Schools.
Kelly, James P., and Benjamin Scafidi. 2013. “More Than Scores: An Analysis of Why and How Parents Choose Private Schools.” EdChoice. https://www.edchoice.org/research/more-than-scores/.
MacLeod, Angela, Sasha Parvani, and Joel Emes. 2017. “Comparing the Family Income of Students in Alberta’s Independent and Public Schools.” Fraser Institute. https://www.fraserinstitute.org/studies/comparing-the-family-income-of-students-in-albertas-independent-and-public-schools.
Milke, Mark. 2017. “Missing Family Dynamics: Canadian Discussions About Family Fracturing, Poverty, and Inequality.” Cardus. https://www.cardus.ca/research/work-economics/reports/missing-family-dynamics/.
Mirski, J. 2005. “Why Some Ontario Parents and Guardians Choose Private Schooling.” Master’s thesis, Queen’s University.
Mirtle, J. 2013. “The Great Offside: How Canadian Hockey Is Becoming a Game Strictly for the Rich.” Globe and Mail, November 8. https://www.theglobeandmail.com/news/national/time-to-lead/the-great-offside-how-canadian-hockey-is-becoming-a-game-strictly-for-the-rich/article15349723/.
Mrozek, Andrea, and Peter Jon Mitchell. 2018. “New Census Data Shows Fewer Children Living with Married Parents: Provincial and Territorial Breakdown.” Cardus. https://www.cardus.ca/research/family/reports/new-census-data-shows-fewer-children-living-with-married-parents/.
Murray, Charles. 2013. Coming Apart : The State of White America, 1960–2010. New York: Crown Forum.
Paquette, J. 2000. “Public Funding for ‘Private’ Education: The Equity Challenge of Enhanced Choice.” American Journal of Education 111, no. 4:568–95.
Pennings, Ray, David Sikkink, Ashley Berner, Julie W. Dallavis, Sara Skiles, and Christian Smith. 2014. “Cardus Education Survey: Private Schools for the Public Good.” Cardus. https://www.cardus.ca/research/education/reports/cardus-education-survey-2014-private-schools-for-the-public-good/.
Pennings, Ray, David Sikkink, Deani Van Pelt, Harro Van Brummelen, and Amy von Heyking. 2012. “Cardus Education Survey: A Rising Tide Lifts All Boats.” Cardus. https://www.cardus.ca/research/education/reports/cardus-education-survey-phase-ii-report-2012/.
Pennings, Ray, John Seel, Deani Van Pelt, David Sikkink, and Kathryn Wiens. 2011. “Cardus Education Survey.” Cardus. https://www.cardus.ca/research/education/reports/cardus-education-survey-phase-i-report-2011/.
Perry, Mark J. 2013. “Why Do Public School Teachers Send Their Own Children to Private Schools at a Rate 2X the National Average?” Carpe Diem (blog), American Enterprise Institute, October 9. https://www.aei.org/carpe-diem/why-do-public-school-teachers-send-their-own-children-to-private-schools-at-a-rate-2x-the-national-average/.
Peterson, Paul E., and Samuel Barrows. 2016. “Teachers More Likely to Use Private Schools for Their Own Kids.” EducationNext, January 11. https://www.educationnext.org/teachers-more-likely-to-use-private-schools-for-their-own-kids/.
Pew Research Center. 2015. “The American Middle Class Is Losing Ground.” December 9. https://www.pewsocialtrends.org/2015/12/09/the-american-middle-class-is-losing-ground/.
Reeves, Richard V., Katherine Guyot, and Eleanor Krause. 2018. “Defining the Middle Class: Cash, Credentials, or Culture?” Brookings Institution, May 7. https://www.brookings.edu/research/defining-the-middle-class-cash-credentials-or-culture/.
Sarlo, Christopher A. 2019. “The Causes of Poverty.” Fraser Institute. https://www.fraserinstitute.org/sites/default/files/causes-of-poverty.pdf.
Statistics Canada. 2011. “Catalogue no. 98-312-XCB2011017.” 2011 Census of Population.
———. 2013. “Ontario (Code 35) (Table).” National Household Survey (NHS) Profile. 2011 National Household Survey. Statistics Canada Catalogue no. 99-004-XWE. http://www12.statcan.gc.ca/nhs-enm/2011/dp-pd/prof/index.cfm?Lang=E.
———. 2016. “Catalogue no. 98-400-X2016304. Table 14-10-0297-01 Labour Force Characteristics by Occupation, Annual (x 1,000).” 2016 Census of Population.
———. 2017. “2016 Census. Catalogue no. 98-316-X2016001.” November 29.
———. 2018. “Canada’s Rural Population Since 1851.” 2011 Census. Catalogues no. 98-310-X-2011003. July 23. https://www12.statcan.gc.ca/census-recensement/2011/as-sa/98-310-x/98-310-x2011003_2-eng.cfm.
———. 2019. “2016 Census of Population, Statistics Canada Catalogue no. 98-400-X2016295.”
———. 2020a. “Table 11-10-0012-01 Distribution of Total Income by Census Family Type and Age of Older Partner, Parent or Individual.” doi:https://doi.org/10.25318/1110001201-eng.
———. 2020b. “Table 14-10-0287-02 Labour Force Characteristics by Age Group, Monthly, Seasonally Adjusted.”
Turcotte, Martin. 2015. “Civic Engagement and Political Participation in Canada.” General Social Survey. November 11. https://www150.statcan.gc.ca/n1/pub/89-652-x/89-652-x2015006-eng.htm.
Ungerleider, C. 2003. Failing Our Kids: How We Are Ruining Our Public Schools. Toronto: McClelland & Stewart.
Van Pelt, Deani A. 2003. “Home Education in Canada: A Report on the Pan-Canadian Study on Home Education.” Canadian Centre for Home Education.
Van Pelt, Deani. 2015. “Home Schooling in Canada: The Current Picture.” Fraser Institute. https://www.fraserinstitute.org/sites/default/files/home-schooling-in-canada-2015-rev2.pdf.
Van Pelt, Deani A., Patricia A. Allison, and Derek J. Allison. 2007. “Ontario’s Private Schools: Who Chooses Them and Why?” Fraser Institute. https://www.fraserinstitute.org/sites/default/files/OntariosPrivateSchools.pdf.
Van Pelt, Deani, David Hunt, and Johanna Wolfert. 2019. “Who Chooses Ontario Independent Schools and Why?” Cardus. https://www.cardus.ca/research/education/reports/who-chooses-ontario-independent-schools-and-why/.
Wang, Wendy, and W. Bradford Wilcox. 2017. “The Millennial Success Sequence: Marriage, Kids, and the ‘Success Sequence’ Among Young Adults.” American Enterprise Institute and Institute for Family Studies. https://www.aei.org/research-products/working-paper/millennials-and-the-success-sequence-how-do-education-work-and-marriage-affect-poverty-and-financial-success-among-millennials/.
